What Is Ichimoku Kinko-Hyo?
One look at market balance
Based on “At One Glance” by Grey Rabbit · © Grey Rabbit LLC
At a Glance
- Definition
- A market-analysis system designed to reveal equilibrium, trend and structure in one view.
- Key takeaway
- The five lines work together; no single line is the complete system.
- Common mistake
- Treating Ichimoku as nothing more than a cloud crossover indicator.
- Live market use
- Open Gold, Silver, Bitcoin, or SPY Simple Chart with Ichimoku enabled and practice naming trend vs balance first.
What you will learn
- Explain the translation and purpose of Ichimoku Kinko-Hyo
- Describe why equilibrium (balance) is central to the method
- List what the system covers beyond a single indicator line
- Relate Ichimoku reading to live Grey Rabbit market charts
Why it matters
Without the system view, traders cherry-pick one line and miss confirmation. Grey Rabbit charts show the full Ichimoku stack so you can train the same “at one glance” habit taught in At One Glance.
30-second summary
Ichimoku was built so a trained eye can see market equilibrium quickly. “Kinko” points to balance; “Hyo” to the chart. The five lines, cloud, wave ideas, and timing counts work as one methodology.
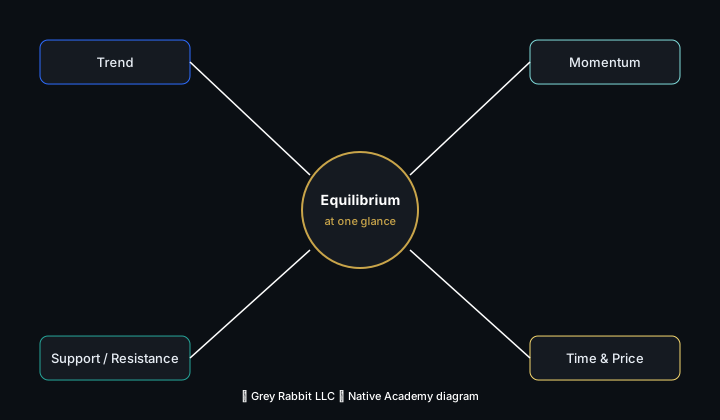
Ichimoku as one-look equilibrium: trend, momentum, support/resistance, time, and price together.
© Grey Rabbit LLC · Native Academy diagram (ebook crop pending when PDF is available)
Key takeaway: If you cannot state whether price is above or below equilibrium structure at a glance, zoom out before trading the next cross.
Translation and purpose
Common English glosses include “one look,” “equilibrium,” and “balance chart.” The practical goal is the same: read the market’s current state of balance or imbalance without stitching five unrelated tools together.
A complete system
The five lines describe short- and medium-term equilibrium, projected support/resistance (Kumo), and lagged confirmation (Chikou). Wave, time, and price-target theory extend that same balance philosophy. Candlestick context still matters — Ichimoku does not replace price action; it organizes it.
Why equilibrium matters
Trends form when balance breaks and new structure holds. Mean reversion appears when price stretches from equilibrium and is pulled back. Personal discipline mirrors the same idea: process over impulse.
Conceptual market frame
On a daily gold chart, ask in order: Is price above or below the Kumo? Are Tenkan and Kijun aligned with that bias? Is Chikou in open space or jammed in historical congestion? Do not invent a live price — use the structure you see on the chart.
Common Mistakes
- Treating Ichimoku as one “cloud indicator” instead of a system
- Predicting outcomes from a single cross without confirmation
- Ignoring time and wave context taught later in the path
Key checklist
- Can state the meaning of Kinko-Hyo in plain language
- Can list trend, momentum, S/R, time, and price as system roles
- Can open a live market chart and describe balance vs imbalance